Step 1: Install Required Dependencies
We need to install required libraries like gcc, glibc, glibc-common and GD and its development libraries before installing.
[root@tecmint]# yum install -y gcc glibc glibc-common gd gd-devel make net-snmp openssl-devel
-------------- On Fedora 22+ Onwards --------------
[root@tecmint]# dnf install -y gcc glibc glibc-common gd gd-devel make net-snmp openssl-devel
Step 2: Create Nagios User
Create a new nagios user account and set a password.
[root@tecmint]# useradd nagios
[root@tecmint]# passwd nagios
Step 3: Install the Nagios Plugins
Create a directory for installation and all its future downloads.
[root@tecmint]# cd /root/nagios
Now download latest Nagios Plugins 2.1.2 package with wget command.
[root@tecmint nagios~]# wget https://www.nagios-plugins.org/download/nagios-plugins-2.1.2.tar.gz
Step 4: Extract Nagios Plugins
Run the following tar command to extract the source code tarball.
[root@tecmint nagios~]# tar -xvf nagios-plugins-2.1.2.tar.gz
After, extracting one new folder will appear in that directory.
[root@tecmint nagios ~]# ls -l
total 2640
drwxr-xr-x. 15 root root    4096 Aug  1 21:58 nagios-plugins-2.1.2
-rw-r--r--.  1 root root 2695301 Aug  1 21:58 nagios-plugins-2.1.2.tar.gz
Step 5: Compile and Install Nagios Plugins
Next, compile and install using following commands
[root@tecmint nagios]# cd nagios-plugins-2.1.2
[root@tecmint nagios-plugins-2.1.2]# ./configure
[root@tecmint nagios-plugins-2.1.2]# make
[root@tecmint nagios-plugins-2.1.2]# make install
Set the permissions on the plugin directory.
[root@tecmint nagios-plugins-2.1.2]# chown nagios.nagios /usr/local/nagios
[root@tecmint nagios-plugins-2.1.2]# chown -R nagios.nagios /usr/local/nagios/libexec
Step 6: Install Xinetd
Most of the systems, its by default installed. If not, install xinetd package using following yum command.
[root@tecmint nagios-plugins-2.1.2]# yum install xinetd
-------------- On Fedora 22+ Onwards --------------
[root@tecmint nagios-plugins-2.1.2]# dnf install xinetd
Step 7: Install NRPE Plugin
Download latest NRPE Plugin 3.0 packages with wget command.
[root@tecmint nagios-plugins-2.1.2]# cd /root/nagios
[root@tecmint nagios]# wget http://liquidtelecom.dl.sourceforge.net/project/nagios/nrpe-3.x/nrpe-3.0.tar.gz
Unpack the NRPE source code tarball.
[root@tecmint nagios]# tar xzf nrpe-3.0.tar.gz
[root@tecmint nrpe-3.0]# cd nrpe-3.0
Compile and install the NRPE addon.
[root@tecmint nrpe-3.0]# ./configure
[root@tecmint nrpe-3.0]# make all
Next, install the NRPE plugin daemon, and sample daemon config file.
[root@tecmint nrpe-3.0]# make install-plugin
[root@tecmint nrpe-3.0]# make install-daemon
[root@tecmint nrpe-3.0]# make install-daemon-config
Install the NRPE daemon under xinetd as a service.
[root@tecmint nrpe-3.0]# make install-xinetd
OR
[root@tecmint nrpe-3.0]# make install-inetd
Now open /etc/xinetd.d/nrpe file and add the localhost and IP address of the Nagios Monitoring Server.
only_from = 127.0.0.1 localhost <nagios_ip_address>
Next, open /etc/services file add the following entry for the NRPE daemon at the bottom of the file.
nrpe 5666/tcp NRPE
Restart the xinetd service.
[root@tecmint]# service xinetd restart
Step 8: Verify NRPE Daemon Locally
Run the following command to verify the NRPE daemon working correctly under xinetd.
[root@tecmint]# netstat -at | grep nrpe
tcp        0      0 *:nrpe                      *:*                         LISTEN
If you get output similar to above, means it working correctly. If not, make sure to check the following things.
- Check you’ve added nrpe entry correctly in /etc/services file
- The only_from contains an entry for “nagios_ip_address” in the /etc/xinetd.d/nrpe file.
- The xinetd is installed and started.
- Check for the errors in the system log files for about xinetd or nrpe and fix those problems.
Next, verify the NRPE daemon is functioning properly. Run the “check_nrpe” command that was installed earlier for testing purposes.
[root@tecmint]# /usr/local/nagios/libexec/check_nrpe -H localhost
You will get a following string on the screen, it shows you what version of NRPE is installed:
NRPE v3.0
Step 9: Configure Firewall Rules
Make sure that the Firewall on the local machine will allow the NRPE daemon to be accessed from remote servers. To do this, run the following iptables command.
-------------- On RHEL/CentOS 6/5 and Fedora --------------
[root@tecmint]# iptables -A INPUT -p tcp -m tcp --dport 5666 -j ACCEPT
-------------- On RHEL/CentOS 7 and Fedora 19 Onwards --------------
[root@tecmint]# firewall-cmd --permanent --zone=public --add-port=5666/tcp
Run the following command to Save the new iptables rule so it will survive at system reboots.
-------------- On RHEL/CentOS 6/5 and Fedora --------------
[root@tecmint]# service iptables save
Step 10: Customize NRPE commands
The default NRPE configuration file that got installed has several command definitions that will be used to monitor this machine. The sample configuration file located at.
[root@tecmint]# vi /usr/local/nagios/etc/nrpe.cfg
The following are the default command definitions that are located at the bottom of the configuration file. For the time being, we assume you are using these commands. You can check them by using the following commands.
# /usr/local/nagios/libexec/check_nrpe -H localhost -c check_users
USERS OK - 1 users currently logged in |users=1;5;10;0
# /usr/local/nagios/libexec/check_nrpe -H localhost -c check_load
OK - load average: 3.90, 4.37, 3.94|load1=3.900;15.000;30.000;0; load5=4.370;10.000;25.000;0; load15=3.940;5.000;20.000;0;
# /usr/local/nagios/libexec/check_nrpe -H localhost -c check_hda1
DISK OK - free space: /boot 154 MB (84% inode=99%);| /boot=29MB;154;173;0;193
# /usr/local/nagios/libexec/check_nrpe -H localhost -c check_total_procs
PROCS CRITICAL: 297 processes
# /usr/local/nagios/libexec/check_nrpe -H localhost -c check_zombie_procs
PROCS OK: 0 processes with STATE = Z
You can edit and add new command definitions by editing the NRPE config file. Finally, you’ve successfully installed and configured NRPE agent on the Remote Linux Host. Now it’s time to install a NRPE component and add some services on your Nagios Monitoring Server…
On Nagios Monitoring Server
Now login into your Nagios Monitoring Server. Here you will need to do following things:
- Install the check_nrpe plugin.
- Create a Nagios command definition using the check_nrpe plugin.
- Create Nagios host and add service definitions for monitoring the remote Linux host.
Step 1: Install NRPE Plugin
Go to the nagios download directory and download latest NRPE Plugin with wget command.
[root@tecmint]# cd /root/nagios
[root@tecmint]# wget http://liquidtelecom.dl.sourceforge.net/project/nagios/nrpe-3.x/nrpe-3.0.tar.gz
Unpack the NRPE source code tarball.
[root@tecmint]# tar xzf nrpe-3.0.tar.gz
[root@tecmint]# cd nrpe-3.0
Compile and install the NRPE addon.
[root@tecmint]# ./configure
[root@tecmint]# make all
[root@tecmint]# make install-daemon
Step 2: Verify NRPE Daemon Remotely
Make sure that the check_nrpe plugin can communicate with the NRPE daemon on the remote Linux host. Add the IP address in the command below with the IP address of your Remote Linux host.
[root@tecmint]# /usr/local/nagios/libexec/check_nrpe -H <remote_linux_ip_address>
You will get a string back that shows you what version of NRPE is installed on the remote host, like this:
NRPE v3.0
If your receive a plugin time-out error, then check the following things.
- Make sure your firewall isn’t blocking the communication between the remote host and the monitoring host.
- Make sure that the NRPE daemon is installed correctly under xinetd.
- Make sure that the remote Linux host firewall rules blocking the monitoring server from communicating to the NRPE daemon.
Adding Remote Linux Host to Nagios Monitoring Server
To add a remote host you need to create a two new files “hosts.cfg” and “services.cfg” under “/usr/local/nagios/etc/” location.
[root@tecmint]# cd /usr/local/nagios/etc/
[root@tecmint]# touch hosts.cfg
[root@tecmint]# touch services.cfg
Now add these two files to main Nagios configuration file. Open nagios.cfg file with any editor.
[root@tecmint]# vi /usr/local/nagios/etc/nagios.cfg
Now add the two newly created files as shown below.
# You can specify individual object config files as shown below:
cfg_file=/usr/local/nagios/etc/hosts.cfg
cfg_file=/usr/local/nagios/etc/services.cfg
Now open hosts.cfg file and add the default host template name and define remote hosts as shown below. Make sure to replace host_name, alias and address with your remote host server details.
[root@tecmint]# vi /usr/local/nagios/etc/hosts.cfg
## Default Linux Host Template ##
define host{
name                            linux-box               ; Name of this template
use                             generic-host            ; Inherit default values
check_period                    24x7
check_interval                  5
retry_interval                  1
max_check_attempts              10
check_command                   check-host-alive
notification_period             24x7
notification_interval           30
notification_options            d,r
contact_groups                  admins
register                        0                       ; DONT REGISTER THIS - ITS A TEMPLATE
}
## Default
define host{
use                             linux-box               ; Inherit default values from a template
host_name                       tecmint          ; The name we're giving to this server
alias                           CentOS 6                ; A longer name for the server
address                         5.175.142.66            ; IP address of Remote Linux host
}
Next open services.cfg file add the following services to be monitored.
[root@tecmint]# vi /usr/local/nagios/etc/services.cfg
define service{
use                     generic-service
host_name               tecmint
service_description     CPU Load
check_command           check_nrpe!check_load
}
define service{
use                     generic-service
host_name               tecmint
service_description     Total Processes
check_command           check_nrpe!check_total_procs
}
define service{
use                     generic-service
host_name               tecmint
service_description     Current Users
check_command           check_nrpe!check_users
}
define service{
use                     generic-service
host_name               tecmint
service_description     SSH Monitoring
check_command           check_nrpe!check_ssh
}
define service{
use                     generic-service
host_name               tecmint
service_description     FTP Monitoring
check_command           check_nrpe!check_ftp
}
Now NRPE command definition needs to be created in commands.cfg file.
[root@tecmint]# vi /usr/local/nagios/etc/objects/commands.cfg
Add the following NRPE command definition at the bottom of the file.
###############################################################################
# NRPE CHECK COMMAND
#
# Command to use NRPE to check remote host systems
###############################################################################
define command{
command_name check_nrpe
command_line $USER1$/check_nrpe -H $HOSTADDRESS$ -c $ARG1$
}
Finally, verify Nagios Configuration files for any errors.
[root@tecmint]# /usr/local/nagios/bin/nagios -v /usr/local/nagios/etc/nagios.cfg
Total Warnings: 0
Total Errors:   0
Restart Nagios:
[root@tecmint]# service nagios restart
That’s it. Now go to Nagios Monitoring Web interface at “http://Your-server-IP-address/nagios” or “http://FQDN/nagios” and Provide the username “nagiosadmin” and password. Check that the Remote Linux Host was added and is being monitored.
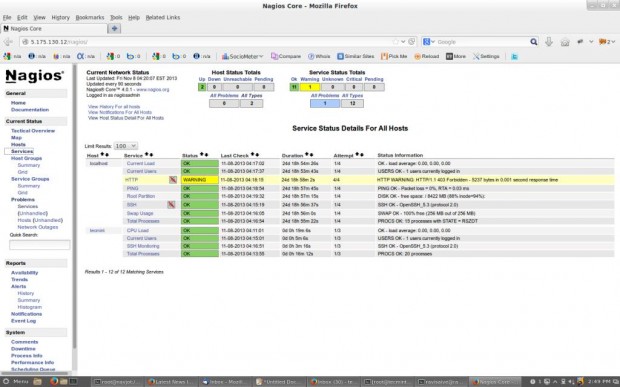
Nagios Remote Host Monitoring